
Fig. 2.
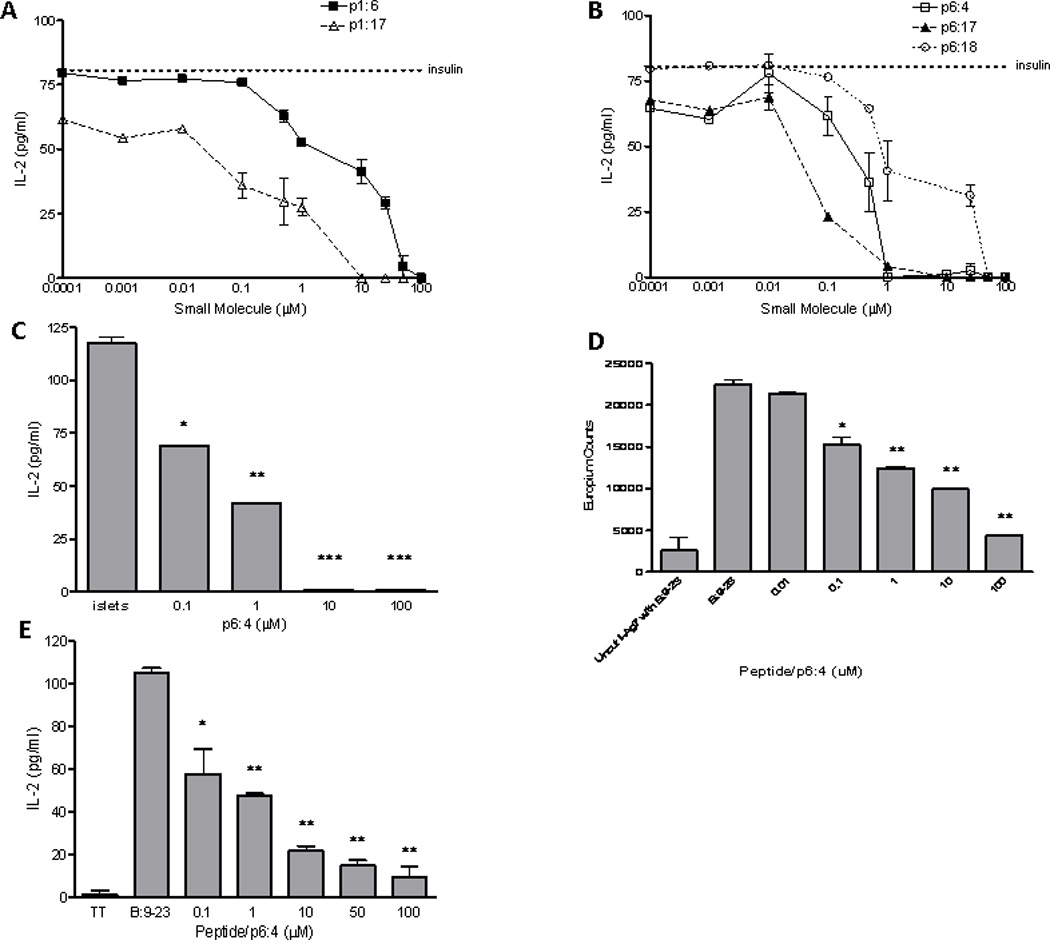
Small molecule inhibitors block presentation of endogenously processed insulin by NOD splenocytes. (A) Inhibition curves for p1 molecules and (B) p6 molecules. Dotted line represents IL-2 production by the 4–8 TCR to insulin in the absence of a small molecule. (C) IL-2 production from a T cell hybridoma cultured with whole islets used as antigen presenting cells. p6:4 molecule inhibits IL-2 production when islets isolated from an adult NOD mouse without diabetes are used for antigen presentation to the 4–8 TCR. *p=0.004, **p=0.002, ***p<0.001 (D) p6:4 inhibits B:9–23 peptide binding to I-Ag7, as determined using a soluble binding assay with purified I-Ag7 protein and biotinylated insulin B:9–23 peptide. Negative control is uncut I-Ag7 (thrombin was not used to cleave the flexible linker and linked peptide) with biotinylated B:9–23 peptide added to the assay. *p=0.023, **p<0.001. (E) p6:4 inhibits a human DQ8 restricted TCR to insulin B:9–23. TT = tetanus toxin (negative control peptide). *p=0.004, **p<0.001.