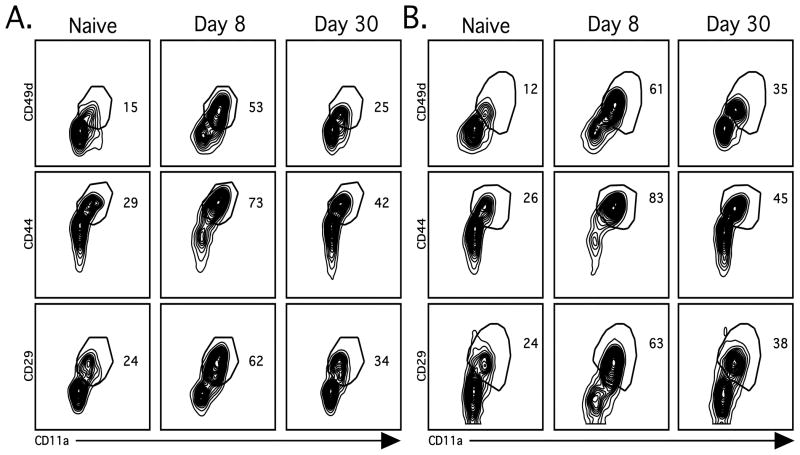
Figure 2.
Identification of surface markers that distinguish endogenous Ag-specific CD4 T cells. (A) Spleens and (B) lungs were harvested from naïve or LCMV-infected mice as described in Figure 1. Representative plots depict cell surface expression patterns of CD11a in combination with either CD49d, CD29 or CD44 on endogenous CD4 T cells (CD4+Thy1.1−). Similar results were obtained from 4 independent experiments with 3–4 mice per group.

