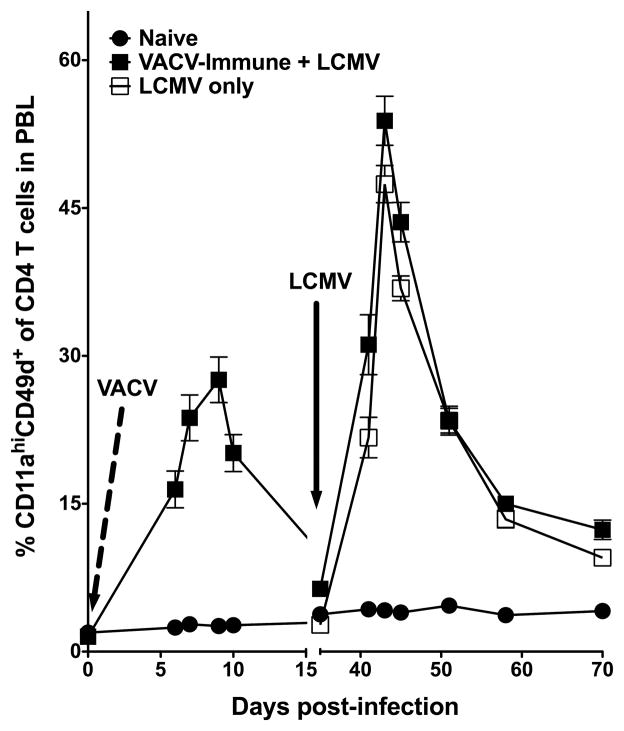
Figure 8.
Tracking newly generated Ag-specific CD4 T cells following heterologous infection. C57BL/6 mice were infected i.p. on Day 0 with VACV (dashed line) and PBL was obtained at the indicated days post-infection and the frequency of CD11ahiCD49d+ CD4 T cells (CD4+CD90.2+) was examined. At day 35 post-infection, these mice and naïve mice were infected with LCMV i.p. (black arrow) and PBL was obtained at the indicated days post-infection and the percentage of CD11ahiCD49d+ CD4 T cells (CD4+CD90.2+) was examined. Combined results are shown from 2 independent experiments with an n=7–8 mice per group. Error bars represent the SEM.

