
Figure 5.
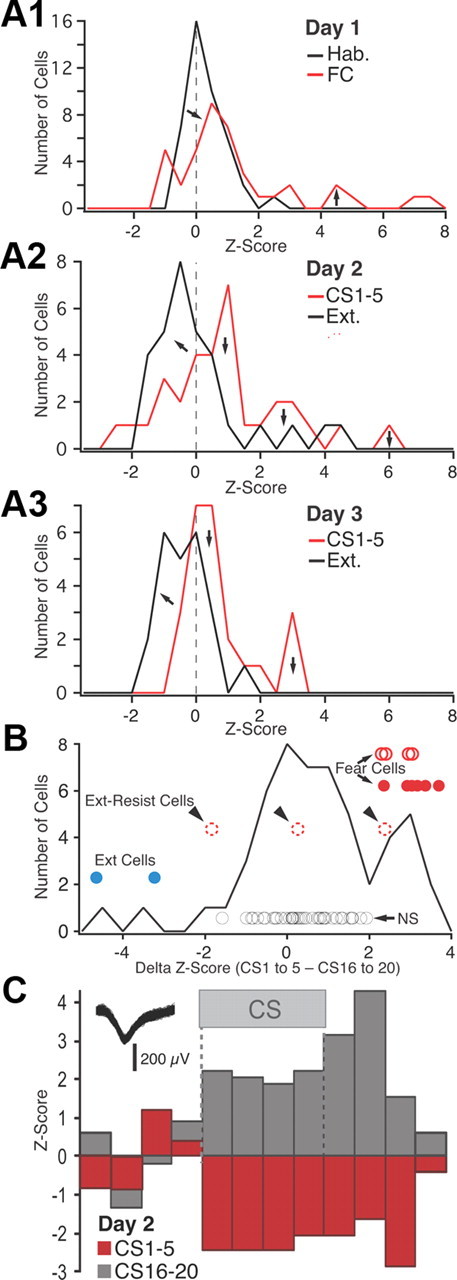
Frequency distribution of z-scored CS responsiveness in BL neurons. A, Frequency distributions of z-scored CS responses (based on average of the four 5 s CS bins) on day 1 (A1), day 2 (A2), and day 3 (A3). See legend at top right corner of each panel for explanation of color coding. FC, Fear conditioning; Ext., extinction. B, Frequency distribution of the difference in z scores between the first five and last five CSs of extinction training (data obtained on days 2 and 3 are combined). The circles represent individual cells (see text). Their position with respect to the y-axis has no meaning; different cell subtypes are offset to various degrees for clarity. Blue, Extinction cells with significant negative z scores in response to CS 1–5 and positive z scores in response to the last five CSs. Red circles, Fear cells (filled red circles, fear cells that were inhibited by the end of extinction training; empty red circles with solid line, fear cells that became unresponsive by the end of extinction training; empty red circles with dashed lines, fear cells that maintained a significant positive response to the last 5 CSs). Black circles, Cells with nonsignificant CS responses at all time points. C, Example of an extinction cell.