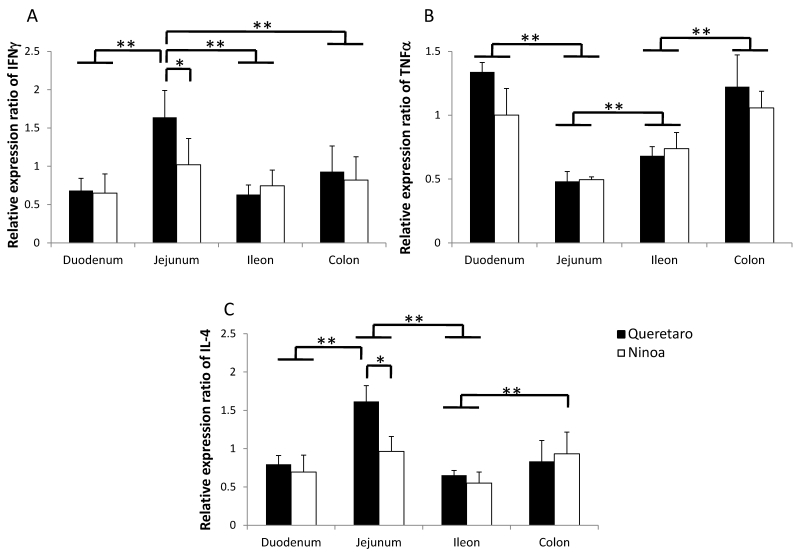
Figure 9.
Gene expression of Th1 and Th2 cytokines. Expression of INFγ, TNFα and IL4 cytokines in sections of the small intestine and colon was analyzed by quantitative RT-PCR and the relative expression ratio was calculated as described in materials and methods. Six mice in two independent experiments were analyzed for each section. Significant differences between strains (* p< 0.05) and between sections (**p< 0.05).

