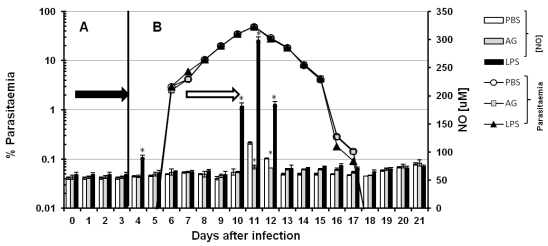
Figure 2.
Time course of parasitaemia and nitric oxide levels in P. chabaudi AS-infected mice treated with aminoguanidine (AG) or LPS. Parasitaemia (left axis) and serum NO concentrations (right axis) were monitored as described in the Materials and Methods in two experimental groups (A and B). Each group contained 6 mice. All animals were infected with P. chabaudi AS and injected i.p. with PBS, aminoguanidine (AG) or with lipopolysaccharide (LPS) at different time points. In group A, after infection with P. chabaudi AS, the mice were injected daily from day 1 to day 3 (black arrow in panel A). In group B, the treatment began 8 days after infection, and the mice were injected daily from day 8 to day 11 (empty arrow in panel B). Each measurement is the average of 6 values obtained from six mice. The bars represent the standard deviation. * indicates statistical significance compared to control mice treated with PBS.

