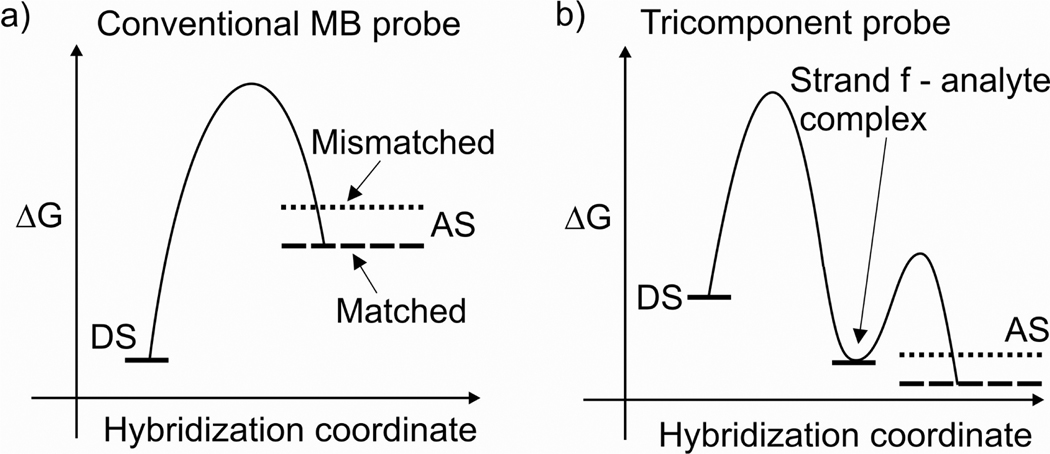
Figure 7.
Putative energy diagrams for hybridization of probes with stem-loop folded analytes. The red lines indicate the energy level of the mismatched probe-analyte associated state (AS), and the blue lines indicate the energy of AS of the probe complex with the fully matched analyte. a) Hybridization of the conventional MB probe. The dissociated sate (DS) of the system has lower energy than the associated state both for matched and mismatched complexes. Probe does not hybridize to the analyte. b) Hybridization of MB-based tricomponent probe. The minimum on the curve corresponds to the complex of strand f with the analyte. AS in this case corresponds to the quadripartite complex of the tricomponent probe with the analyte.

