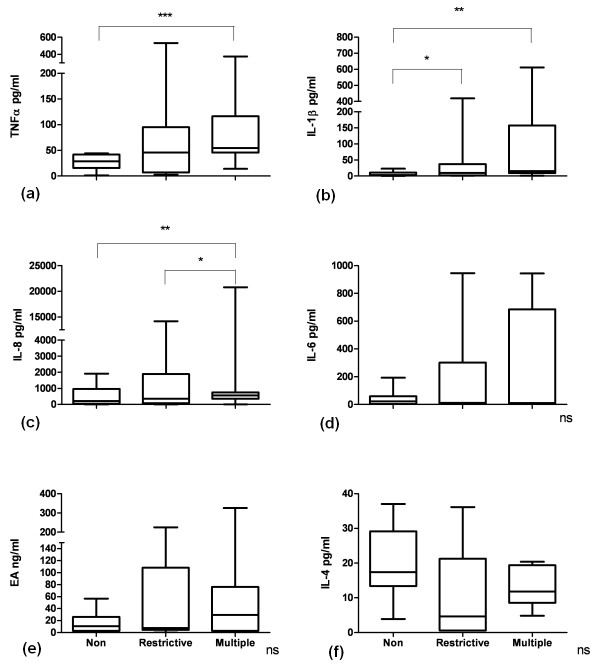
Figure 1.
Boxplots showing cytokine levels in the bronchoalveolar fluid of cardiac surgery patients. (a) TNFα, tumor necrosis factor α. ***P < 0.001. (b) Interleukin (IL)-1β. * P < 0.05; ** P < 0.01. (c) * P < 0.05; ** P < 0.01. (d) ns, not significant. (e) EA, elastase-α1-antitrypsin complex; Non, nontransfused (n = 17); Restrictive, 1 or 2 units of blood transfused (n = 18); Multiple, ≥ 5 units of blood transfused (n = 10). (f) ns, not significant. Nonparametric tests were used for analysis. Boxplots: the lower hinge defined as the 25th percentile, middle as 50th percentile and upper hinge as the 75th percentile. Whiskers define lowest and highest observation.

