
Figure 4.
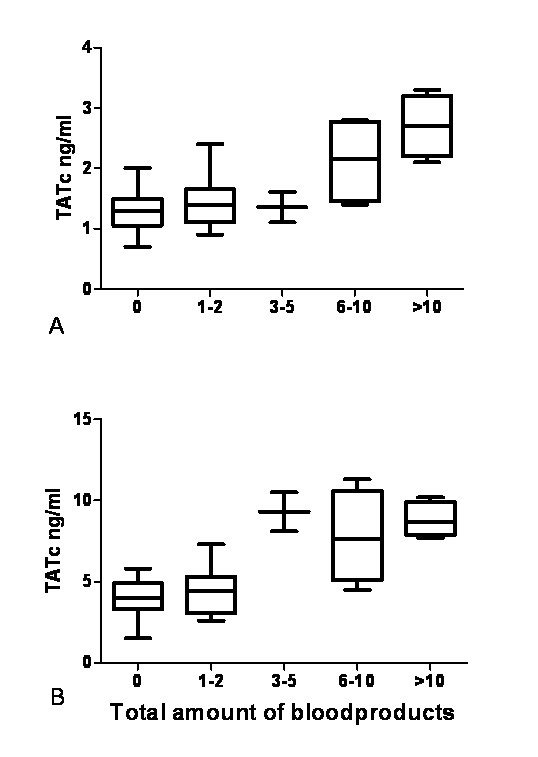
Boxplots showing TATc according to amount of blood products transfused per patient. Boxplots showing thrombin-antithrombin complexes (TATc) in (a) bronchoalveolar fluid and (b) plasma according to the total amount of blood products given per patient. Boxplots: the lower hinge defined as the 25th percentile, middle as 50th percentile and upper hinge as the 75th percentile. Whiskers define lowest and highest observation.