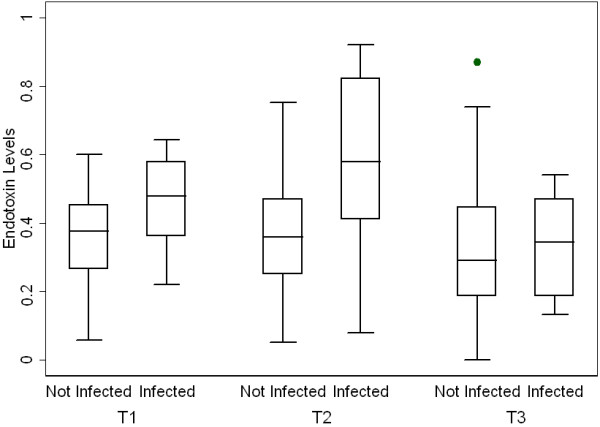
Figure 2.

Box plots for EAA levels in patients that developed post-operative infection versus those that did not. Before (T1, P = 0.0796), during (T2, P = 0.0236) and after CPB (T3, P = 0.8203). Patients who went on to develop post-operative infection had significantly higher EAA levels at T2.
