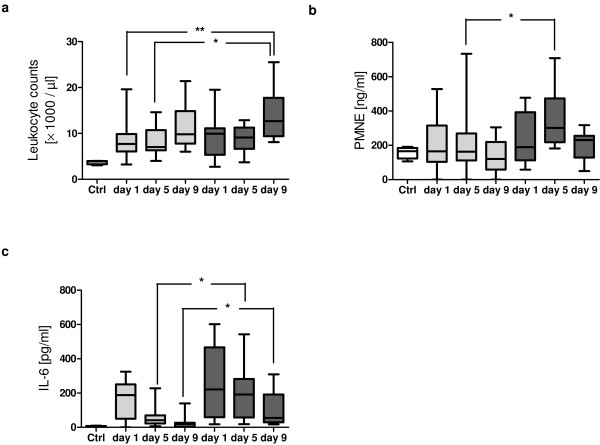
Figure 3.
Leukocyte count, plasma levels of neutrophil elastase (PMNE) and IL-6 levels after major trauma. (a) Total leukocyte counts from controls (n = 4, white box), patients with sepsis development (n = 16, dark gray boxes) and patients with uneventful outcome (n = 29, light gray boxes). (b) PMNE in controls (n = 6, white box), the sepsis group (n = 16, dark gray boxes) and the nonsepsis group (n = 28, light gray boxes). (c) Serum IL-6 levels in trauma patients with sepsis (n = 18, dark gray boxes) and without sepsis (n = 27, light gray boxes). Boxplots represent the median (heavy line in boxes) and the 25th and 75th percentiles (lower and upper lines of the box, respectively). Whiskers indicate the minimum and maximum values, respectively. *P < 0.05, **P < 0.01.

