
Figure 3.
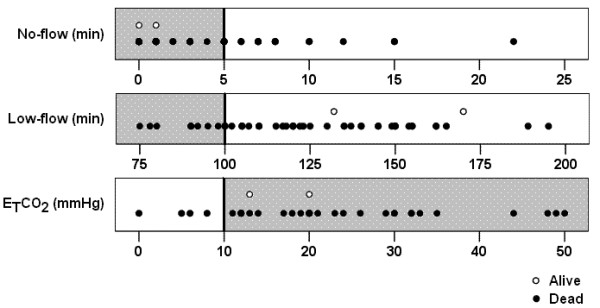
Distribution of the values of no flow (top), low flow (middle) and end tidal CO2 (ETCO2) (bottom) initial arterial pH, blood lactate and kalemia in the studied population (n = 51). The gray zones and vertical bars indicate the threshold considered in the French guidelines for no flow (≤5 min), low flow (≤100 min) and ETCO2 (≥10 mmHg).