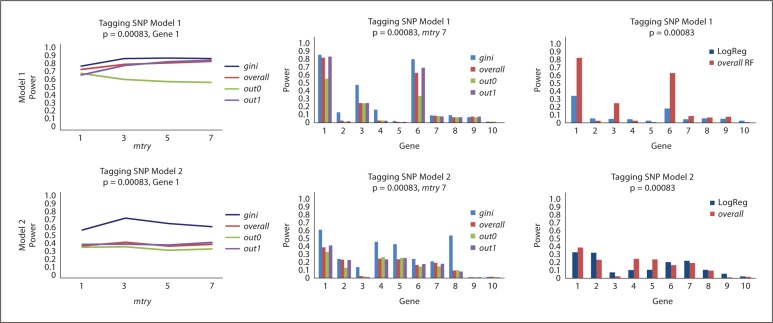
Fig. 5.
RF and MCLR results for tagging SNP simulations. Top row results are based on Model 1 and bottom row results on Model 2. Power is measured on the y-axis and dummy variables are used for the SNPs. RF results are presented only in the left and middle panels. In the left panels, mtry are on the x-axis and different lines represent different variable importance measures. In the middle panels, the power for RF (mtry = 7) for each of the importance measures is shown across all 10 genes. The right panels compare RF (overall importance measure, mtry = 7) to MCLR. For all results, there are 500 observations, nT = 1,000, and the p values are adjusted for 60 SNPs, i.e. 0.05/60 = 0.00083.

