FIGURE 2.
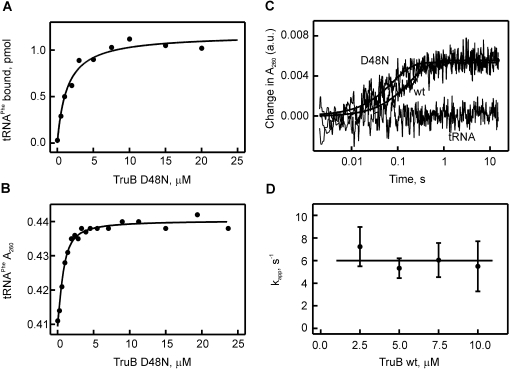
Detecting the interaction of tRNAPhe with TruB by nitrocellulose filtration and absorbance measurements. (A) Nitrocellulose filtration to determine the dissociation constant of [3H]-labeled tRNAPhe to catalytically inactive TruB D48N (KD = 1.4 ± 0.3 μM). (B) Determination of the dissociation constant for the tRNAPhe-TruB D48N interaction by measuring the change in absorbance at 260 nm (the increase in absorbance due to the increasing TruB D48N concentration was subtracted). Hyperbolic fitting yielded a KD of 0.34 ± 0.06 μM. (C) Stopped-flow experiments detecting the change in absorbance at 260 nm upon rapidly mixing tRNAPhe (0.75 μM final concentration) with TruB D48N (10 μM), TruB WT (10 μM), or no TruB (labeled tRNA). The time courses shown are averages of 8–12 individual time courses and were fitted to a one-exponential equation (smooth lines) to determine the apparent rate constants: kapp(WT) = 5.2 sec−1; kapp(D48N) = 12.7 sec−1. Note the logarithmic time scale of the time courses. (D) TruB WT concentration dependence of the apparent rates of individual time courses recorded by stopped-flow measurements as in C. The average apparent rate over all measured concentrations is 6.0 ± 1.8 sec−1, as indicated by the straight line.

