FIGURE 4.
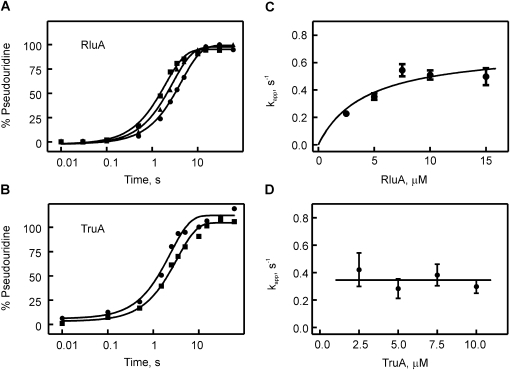
Quench-flow titrations of pseudouridine formation by RluA and TruA. Time courses of pseudouridine formation by RluA (A) and TruA (B) under single-round, pre-steady conditions. In a quench-flow apparatus, [3H]-labeled tRNAPhe (1 μM final concentration) was rapidly mixed, in A, with 2.5 μM (circles), 5.0 μM (triangles), or 10.0 μM (squares) RluA, or, in B, with 2.5 μM (circles) or 10.0 μM (squares) TruA. The percentage of pseudouridine formed at a certain time point was determined using the modified tritium release assay. Smooth lines are the result of fitting the time courses to a one-exponential equation. (C) Dependence of the apparent rate, kapp, of RluA-catalyzed pseudouridine formation under single-round conditions on the enzyme concentration. Apparent rates were determined by single-exponential fitting of quench-flow time courses at increasing RluA concentrations. The data were fit to a hyperbolic equation with a maximal apparent rate of 0.7 ± 0.15 sec−1 (smooth line). (D) Dependence of the apparent rate, kapp, of TruA-catalyzed pseudouridine formation under single-round conditions on the enzyme concentration. The average apparent rate is 0.35 ± 0.2 sec−1 for TruA as indicated by the horizontal line.

