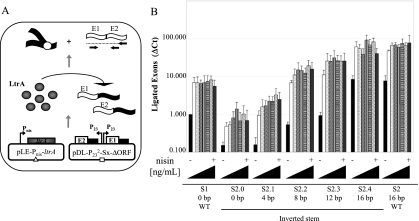
FIGURE 7.
Influence of LtrA levels on Ll.LtrB trans-splicing in L. lactis. (A) Ll.LtrB trans-splicing efficiency was assessed in the presence of various levels of LtrA by monitoring the level of ligated exons by quantitative RT-PCR. LtrA expression was under the control of the Pnis promoter (pLE-Pnis-ltrA). (B) Levels of ligated exon were compared amongst introns having different number of base pairs between the two intron fragments (S2.0ΔORF to S2.4ΔORF, S2ΔORF, S1ΔORF). Ll.LtrB trans-splicing efficiency was assessed in the presence of different levels of LtrA expressed from the nisin inducible promoter: black, 0 ng/mL nisin; white, 0.14 ng/mL; dotted, 0.28 ng/mL; upward diagonals, 0.42 ng/mL; vertical lines, 0.56 ng/mL; horizontal lines, 0.70 ng/mL; downward diagonals, 0.84 ng/mL; gray, 0.98 ng/mL. Exon 1 and exon 2, E1 and E2; Ll.LtrB variants, black lines; ltrA gene, gray box; P23 and Pnis promoters, bent arrows; Ll.LtrB RNA intron fragments, black wavy lines; RNA exons, white wavy lines; LtrA, gray circles; primers used for the qRT-PCR, horizontal arrows.

