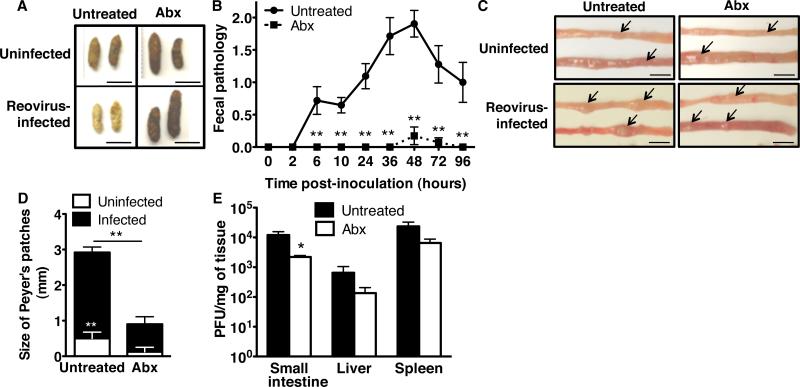
Fig. 3.
Reovirus pathogenesis in microbiota-depleted mice. (A) PVRtg-Ifnar1-/- mice were either uninfected, untreated (n=5) or antibiotic-treated (n=5), or infected perorally with reovirus, untreated (n=13) or antibiotic-treated (n=15). Feces were collected 24 hours post-inoculation. (B) Fecal pathology (Table S1). (C) Upper (top) and lower (bottom) small intestines were harvested from untreated and antibiotic-treated PVRtg-Ifnar1-/- mice on day 4 post-infection or from uninfected mice. Arrows indicate Peyer's patches. (D) Quantification of Peyer's patch sizes (from C) from uninfected and infected mice. (E) Reovirus titers from day 4 post-infection PVRtg-Ifnar1-/-mouse tissues. Plaque assays were performed using murine L929 cells, yielding PFU per milligram of tissue. For B-E, n=4-9 untreated mice, n=2-9 antibiotic-treated mice. Each symbol or bar denotes the mean + SEM. *p<0.05, **p<0.01, Student's t-test. Scale bars in A and C=5mm. A and C, representative of 3-5 experiments; N=2-4 for B, D, and E.

