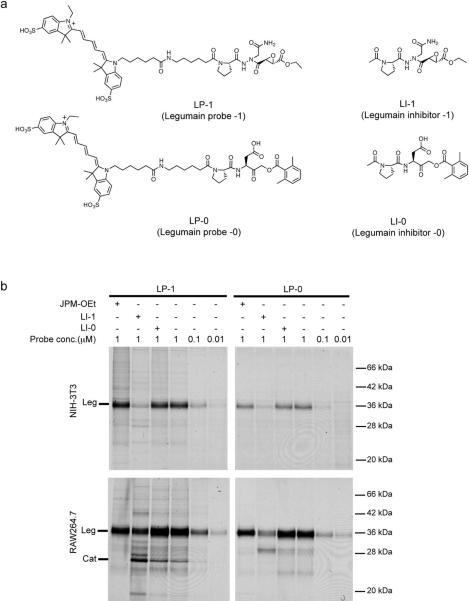
Figure 1.
Legumain inhibitors and probes (a) Structures of Aza-Asn epoxide legumain inhibitor, LI-1 and legumain probe, LP-1 compared to Asp-AOMK inhibitor, LI-0 and probe, LP-0. (b) Direct labeling of legumain in intact cells by LP-1 and LP-0. Intact monolayers of NIH-3T3 fibroblasts (top) or RAW 264.7 macrophages (bottom) were pre-treated with the cathepsin inhibitor JPM-OEt (10 μM; first column), the legumain inhibitors LI-0/LI-1 (10 μM; second and third columns) and labeled by addition of LP-1 and LP-0 at the indicated concentrations.

