Figure 2.
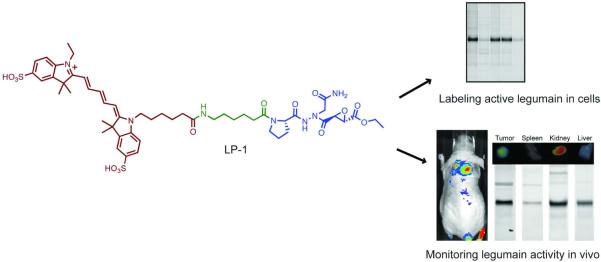
(a) In vivo imaging of active legumain. Mice bearing C2C12/ras xenograft tumors were IV injected with LP-1 (top) or LP-1-ctrl (bottom) probes and mice imaged at the indicated time points. Images are presented using a colorimetric scale based on photons per second per centimeter square per steradian (p s−1 cm−2 sr−1) overlaid on bright light images. (b) Tumor to normal tissue signal ratio calculated from the mice labeled with LP-1 (circle symbols with a solid line) and LP-1 Ctrl (square symbols with a dotted line). Ratios were calculated from multiple mice (n = 3 for LP-1 and n = 2 for LP-1 Ctrl) and represent mean ± standard error. (c) Ex-vivo imaging of organs and protein labeling analyzed by SDS-PAGE. Fluorecently labeled proteins were visulaized by scanning of the gel using a flatbed laser scanner. Each column represents an organ from individual mouse collected after in vivo imaging experiments.

