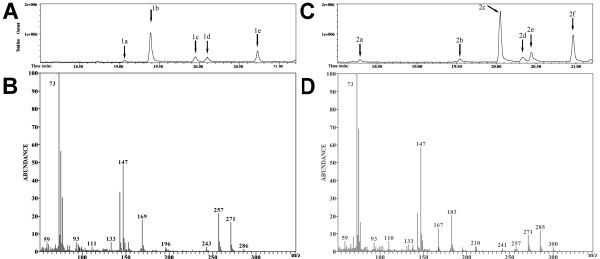
Figure 2.
A, GC-MS total ion chromatogram of the trimethylsilylated ring cleavage product of hydroquinone; B, mass spectrum of peak 1b from Figure 2A; C, GC-MS total ion chromatogram of the trimethylsilylated ring cleavage product of 2-methylhydroquinone; D, mass spectrum of the product peak 2c from Figure 2C.

