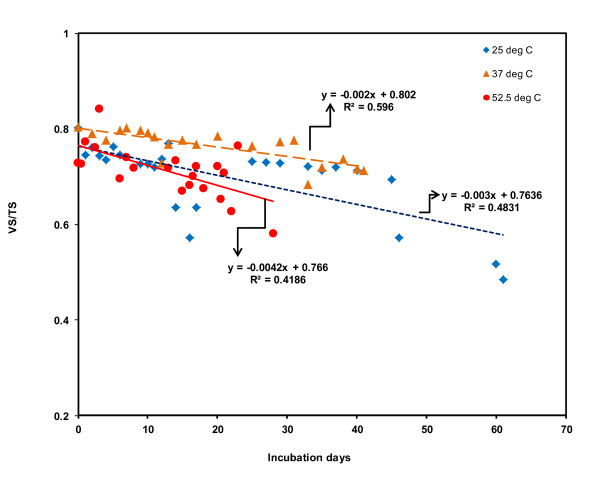
Figure 6.
Impacts of temperatures on changes in ratio between VS and TS (VS/TS). The red solid line indicate regression line, and red circle indicated VS/TS reductions at 52.5°C; the yellow long dash line indicates regression line, and yellow triangles indicate VS/TS at 37°C; the blue short dash line indicates regression line, and the blue diamond indicate VS/TS at 25°C.

