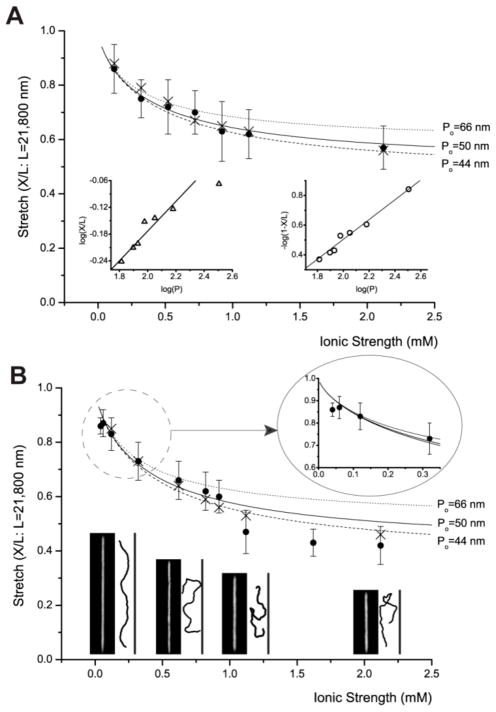
Fig. 2.
Ionic strength dependence of DNA stretching. These graphs include experiment (●: closed circle) and simulation (×: cross) with graphs of Odijk’s equation (Eq. 1), in which persistence length P is determined by OSF equation (Eq. 2). However, this equation is drawn in three different graphs using different non-electrostatic intrinsic persistence length (Po) values such as 50 nm, 66 nm,39 and 44 nm.41 Each experimental data point represents measurement from 30 to 200 molecules; error bars show standard deviations of measured lengths. (A) DNA stretching in 250 nm × 250 nm channels: The left inset depicts a log-log plot of de Gennes relationship of X/L≈ (wP/D2)1/3, and the right inset depicts a log-log plot of Odijk’s equation for square channels 1- X/L=0.085×2× (A/P)2/3. This linear relationship shows R2=0.98. (B) DNA stretching in 250 nm × 400 nm channels: magnified plot describes the details of low ionic strengths (1/80xTE and 1/120xTE). Representative fluorescence images of DNA molecules are compared with simulation snapshots at four ionic strengths: 0.12 mM, 0.62 mM, 1.12 mM, and 2.12 mM. Simulation snapshots are magnified for better comparison.

