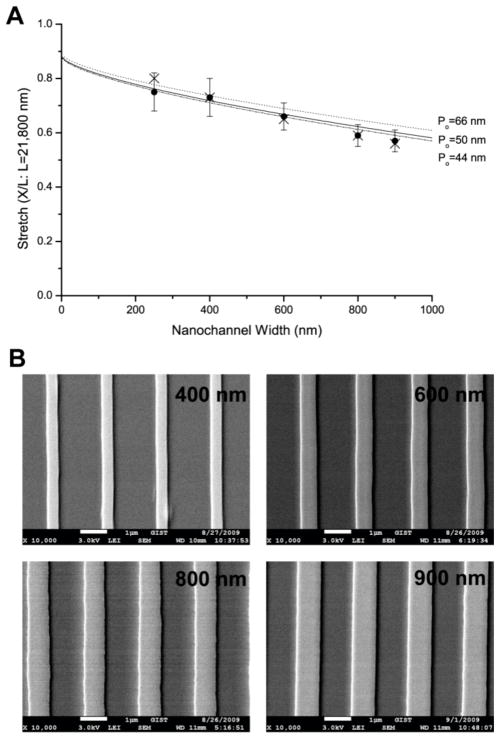
Fig. 3.
Width dependence of DNA stretches with the same height of 250 nm at the fixed ionic strength (1/40xTE and 0.2 mM NaCl). (A) The graph shows experiment (●: closed circle) and simulation (×: cross) with three graphs of Odijk’s equation (Eq. 1) using three different nonelectrostatic intrinsic persistence length (Po) values such as 50 nm, 66 nm,39 and 44 nm.41 Each experimental data point represents measurement from 40 to 90 molecules; error bars show standard deviations of measured lengths. Molecular length is determined by intensity profile analysis illustrated in Fig. 1. We do not include error bars of simulation result because their standard deviation is very small (≤ 1%) (B) Scanning electron micrographs of 250 nm × 400, 600, 800, 900 nm channels’ template on silicon wafer fabricated by interference lithography. The nanochannel templates were utilized for replica molding of PDMS nanochannels for DNA loading.

