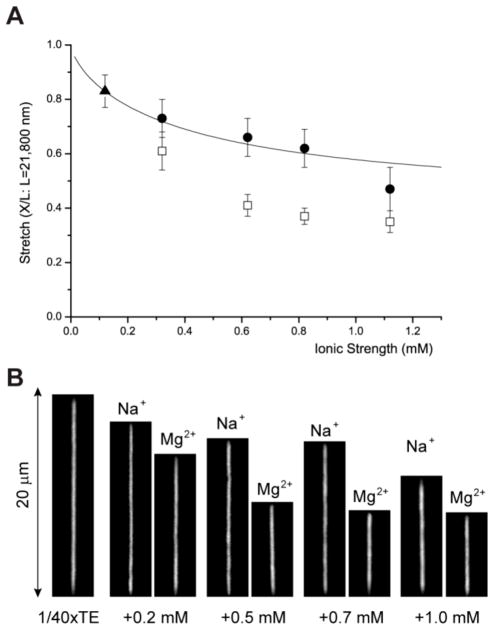
Fig. 4.
Divalent ion effect on DNA stretches in 250 nm × 400 nm channels. (A) The graph shows four points of MgCl2 (□: open square) of equivalent ionic strength of NaCl (●: closed circle) and a reference point of 1/40xTE (▲: closed triangle); these five points are already shown in Fig. 2B. The graph (solid line) of Odijk’s equation (Eq. 1) uses 50 nm as Po. Each experimental data point represents measurement from 30 to 80 molecules; error bars show standard deviations of measured lengths. Molecular length is determined by intensity profile analysis as illustrated in Fig. 1. (B) Representative fluorescence images of DNA molecules at the same ionic strength for visual comparison between the effects of monovalent sodium ions and divalent magnesium ions on DNA stretches.

