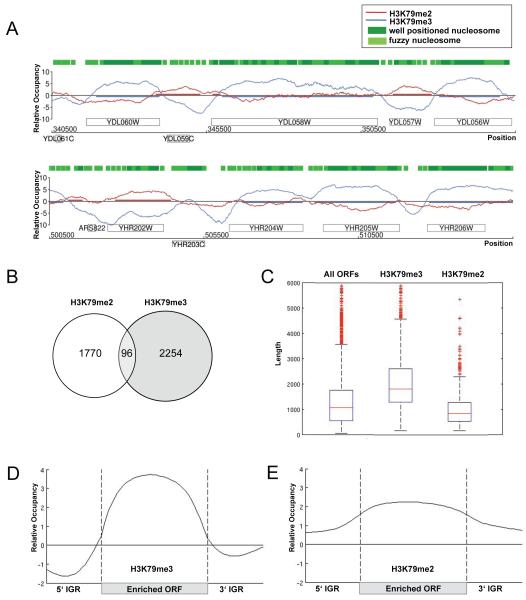
Figure 4. High-resolution profile of H3K79me2 and H3K79me3 across the yeast genome with global occupancy analysis.
(A) H3K79me2 and H3K79me3 profiles. Sample genomic positions for chromosome 4 and 8 were plotted along the x-axis against the relative occupancy of H3K79me2 and H3K79me3 on the y-axis. ORFs are indicated as rectangles, above the axis for Watson genes and below the axis for Crick genes. Green boxes represent HMM-predicted well-positioned and fuzzy nucleosome positions derived from Lee et al. (Lee et al., 2007) (B) Venn diagram comparing the number of H3K79me2 and -me3-enriched ORFs. (C) Average lengths of H3K79me3 and -me2-enriched genes. Boxplots showing the lengths of 6576 ORFs in yeast, as well as, the lengths of H3K79me3 and H3K79me2-enriched ORFs. (D-E) Average profile of H3K79me3 (D) and H3K79me2 (E)-enriched ORFs. A gene was considered to be enriched if at least 50% of its ORF was covered by the modification. ORFs were aligned according to their translational start and stop sites similar to an approach by the Young lab (Pokholok et al., 2005). Each ORF was divided into 40 bins of equal length, probes were assigned accordingly, and average enrichment values were calculated for each bin. Probes in promoter regions (500 base pairs upstream of transcriptional start site) and 3′UTR (500 base pairs downstream of stop site) were assigned to 20 bins, respectively. The average enrichment value for each bin was plotted.

