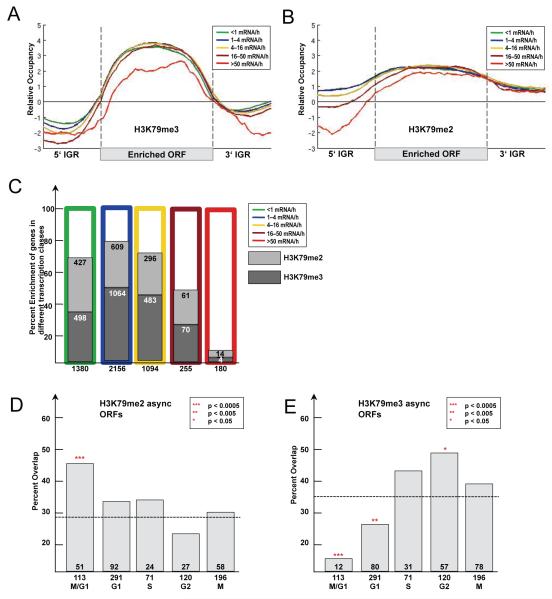
Figure 5. Functional characterization of H3K79 dimethylated genes.
(A-B) Average profiles of H3K79me3 (A) and H3K79me2 (B)-enriched ORFs according to transcriptional activity. All genes for which information was available (Holstege et al., 1998) (Transcriptome 2005) were divided into five classes according to their transcriptional rate. Average gene profiles were computed and plotted as described in Figure 4D. (C) Percent enrichment of H3K79 di- and trimethylated ORFs in different transcriptional classes. As before genes were divided into five classes according to their transcriptional activity (Holstege et al., 1998) and the percent overlap with H3K79 di- and trimethylated ORFs was plotted. (D-E) Overlap of H3K79me2 and H3K79me3-enriched ORFs with transcriptionally regulated genes for each cell cycle stage (Spellman et al., 1998). Numbers below the x-axis represent total number of genes with periodic transcription. Numbers above x-axis represent the overlap of these genes with those enriched for H3K79me2 and H3K79me3. The percentage of the overlap was plotted on the y-axis. (D) H3K79me2-enriched ORFs in asynchronous cells. Expected by chance are 28% (1866 H3K79me2-enriched ORFs out of 6576 total). (E) H3K79me3-enriched ORFs in asynchronous cells. Expected by chance are 36% (2350 H3K79me3-enriched ORFs out of 6576 total). The p-values were calculated using the hypergeometric test.

