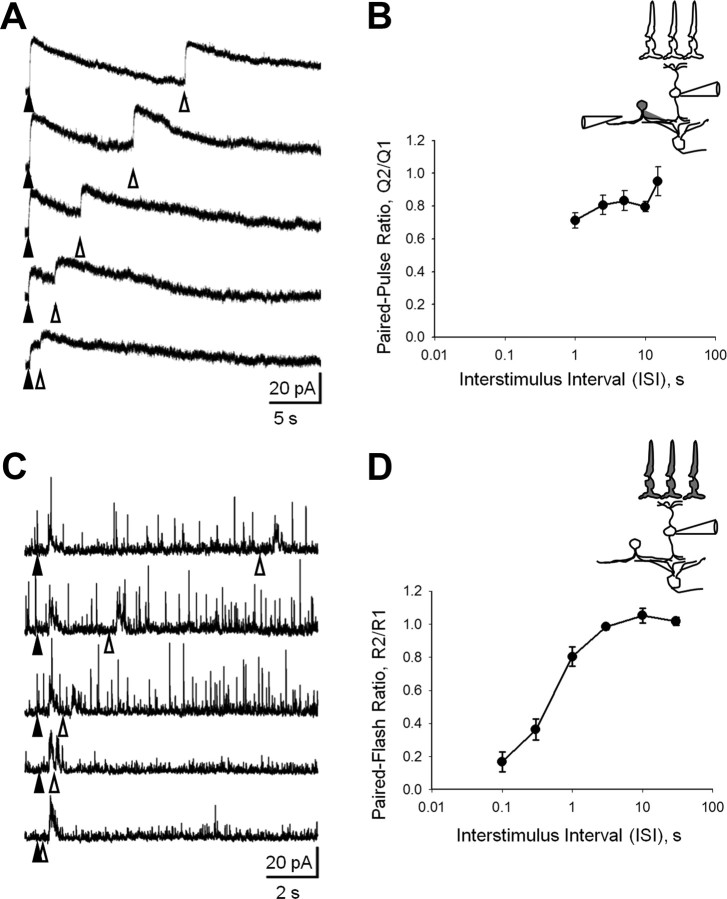
Figure 4.
Inhibition to ON cone bipolar cells shows paired-pulse depression. A, Representative zap-evoked GABAc currents from ON cone BCs in response to pairs of zaps (gray dots) delivered to the IPL adjacent to BC axon terminals. Zap stimuli were 2 ms in duration and had amplitudes ranging from 3 to 7.5 μA, consistent within a cell. Zap artifacts were removed for clarity. B, When the interval between zaps was decreased, GABAC current showed depression (n = 5 cells). C, Representative L-IPSCs from ON cone BCs, in response to pairs of brief (10 ms) light stimuli. When the interval between light stimuli was ≥3 s, the L-IPSCs showed no depression. However, when the interval between light stimuli was decreased, the L-IPSCs showed robust depression. D, Summary data from five cells. Schematics on the right illustrate the retinal circuitry and stimulation paradigms used to elicit and record electrically evoked (A) and light-evoked (C) responses in BCs.

