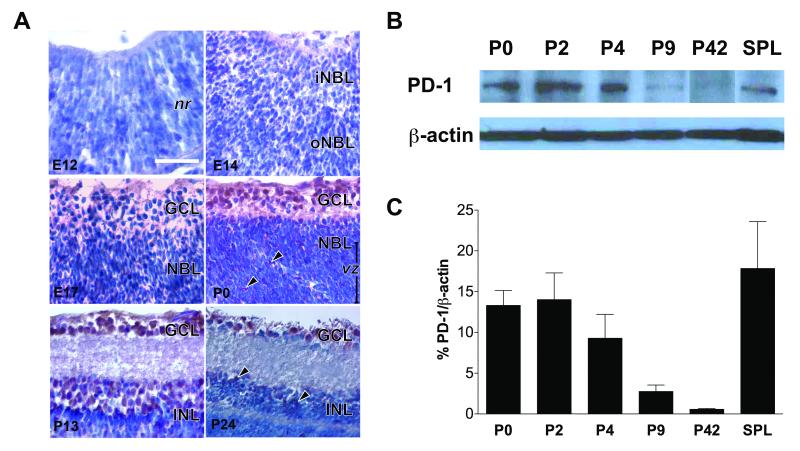
Figure 3.
Dynamic regulation of PD-1 expression during retinal development. (A) Immunohistochemical staining on retinal sections from embryonic days E12, E14, E17, and postnatal days P0, P13, P24. PD-1 (red) and hematoxylin (blue). nr, neural retina; iNBL & oNBL, inner & outer neuroblast layer; GCL, ganglion cell layer; vz, ventricular zone; INL, inner nuclear layer. Scale bar, 50μm. These findings are representative of three experiments. (B) Western blot for PD-1 at P0, P2, P4, P9, P42, and spleen as a positive control. β-actin was used as a loading control. (C) Quantification of PD-1 immunoblots. PD-1 expression decreases by 80±3.8% by P9, and 96±0.9% by P42, as compared to P0 expression; values reported as mean±S.E.M. p=0.03 by ANOVA analysis across all retina samples. SPL, spleen. Negative controls for reagent (secondary antibody only) and tissue (skeletal muscle) showed no detectable staining (data not shown). These findings are representative of three animals per time point.

