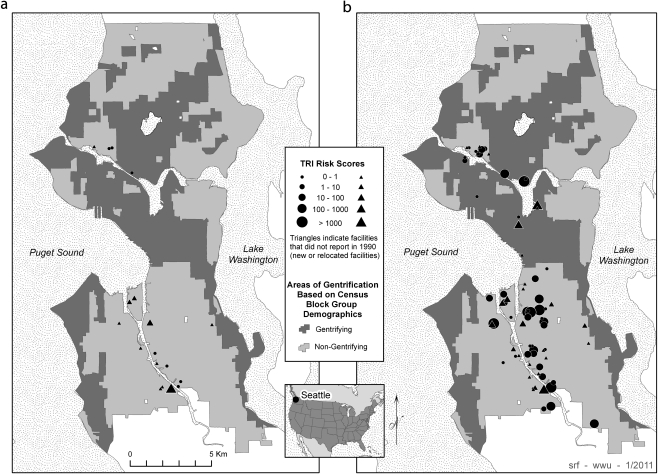
FIGURE 2.
Toxics release inventory (TRI) facility risk characterizations and gentrification areas in (a) 2007 and (b) 1990–2007.
Source: Environmental Protection Agency's (EPA's) TRI Database; EPA's Envirofacts Database; EPA's Risk Screening Environmental Indicators Model (Version 2.3); Census CD 1990 Long Form in 2000 Boundaries; US Census 2000.41,57,58

