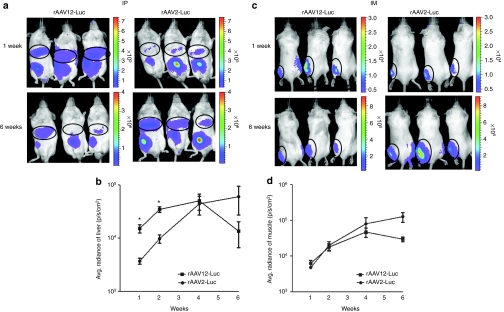
Figure 1.
Recombinant adeno-associated virus type 12 (rAAV12)-Luc transduction of the liver and muscle after intraperitoneal and intramuscular administration. Male BALB/cAnN mice were administered either 1 × 10¹¹ rAAV12-Luc or rAAV2-Luc vector particles by intraperitoneal (IP) route, or 1 × 10¹⁰ rAAV12-Luc or rAAV2-Luc vector particles by intramuscular (IM) route. To visualize luciferase expression, mice underwent real time bioluminescence imaging using Xenogen IVIS-200 System. Images were captured and quantified using Living Image 2.60.1 software. Animals were exposed for 10 minutes before images were captured. (a) Images show luciferase expression in the liver, and at the site of injection, after IP administration 1 and 6 weeks after rAAV12-Luc vector administration, compared to rAAV2-Luc-treated mice. Bioluminescence scales indicate the intensity of luciferase expression in these animals. (b) To quantify luminescence in the liver, this region was selected on captured images and luminescence output was expressed as radiance (photons/second/cm2). Luciferase expression was quantified 1, 2, 4, and 6 weeks after rAAV-Luc vector administration and data is presented on a log scale to allow all time points to be included. Error bars represent the mean radiance + s.e.m, where n = 3. Statistical comparisons were performed by unpaired t-tests (*P < 0.05). (c) Images show luciferase expression in the left anterior muscle 1 and 6 weeks post rAAV-Luc vector administration by IM route. (d) Luciferase expression is quantified in the muscle as before, and presented on a log scale. Error bars represent the mean radiance + s.e.m., where n = 3. Statistical comparisons were performed by unpaired t-tests.

