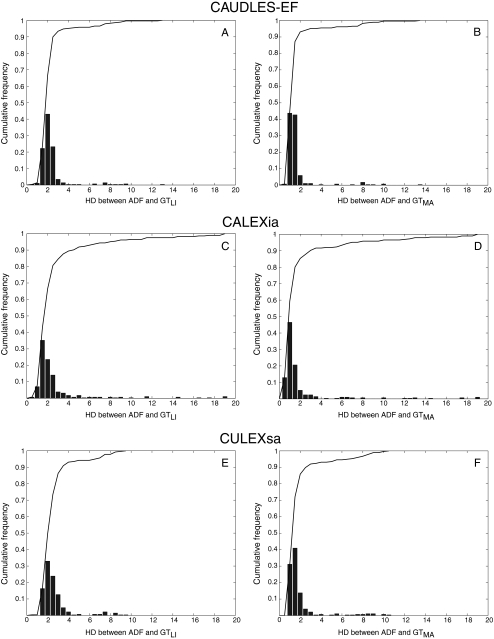
Fig. 8.
Distribution of  and
and  for CAUDLES-EF, CALEXia, and CULEXsa. a, b LI and MA distances for CAUDLES-EF, respectively. c, d LI and MA distances for CALEXia, respectively. e, f LI and MA distances for CULEXsa, respectively. The horizontal axis represents the distance classes in millimeters, and the vertical axis represents the cumulative frequency. The black lines represent the cumulative function of the distance distributions

