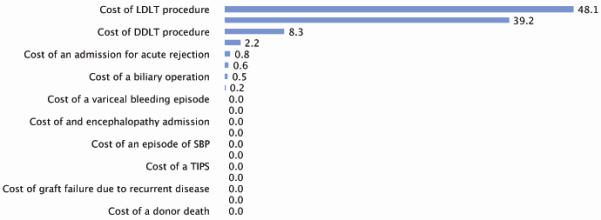
Figure 3. Sensitivity of the model to cost variables.

Number shown is percent of cost-dependent model variability attributable to the listed cost as determined by a tornado diagram sensitivity analysis. Note that within the ranges of the sensitivity analysis, none of the cost variability was able to change the fundamental cost-effectiveness of the treatment strategies. See text for details. All values listed as 0.0 were not statistically significant contributors to overall model variability.
