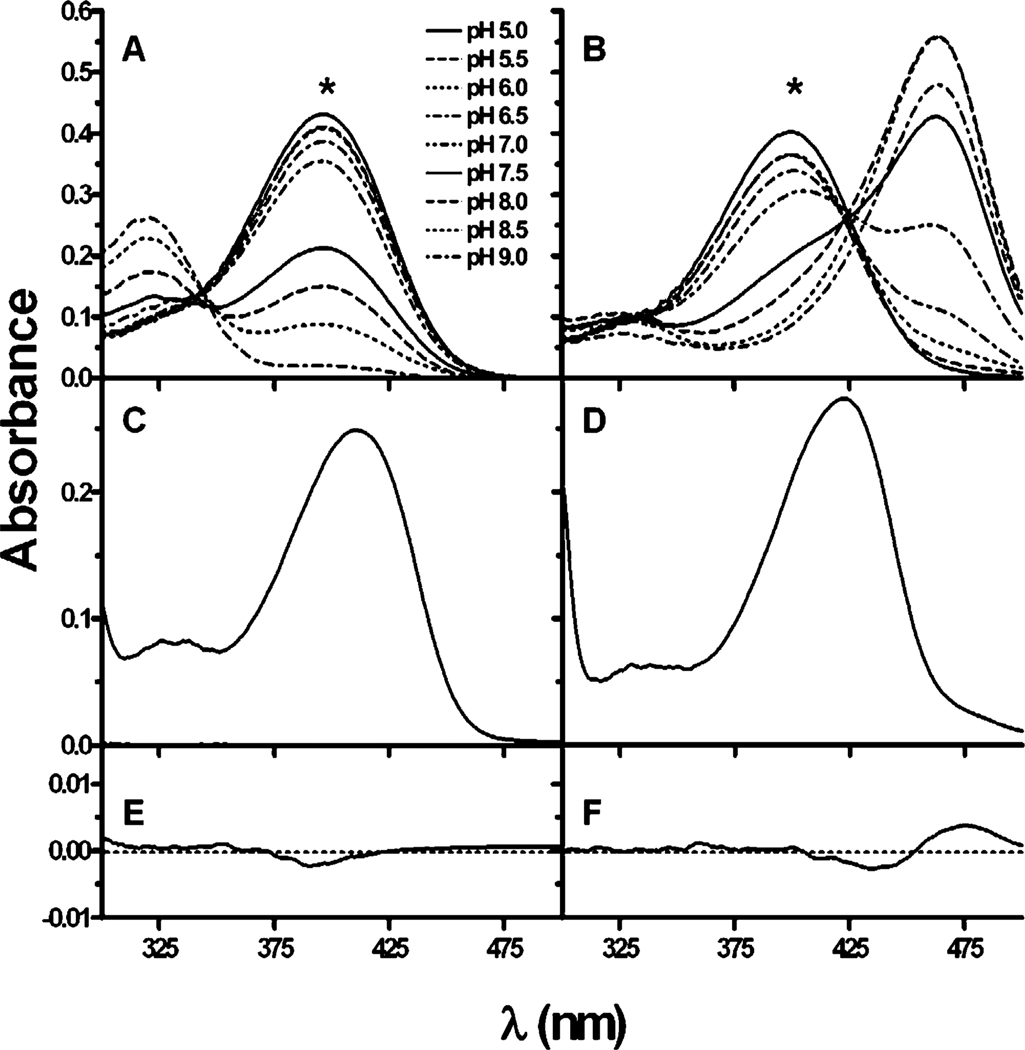
Figure 4.
Absorption spectra of 3-(2,4-dimethoxybenzylidene)-anabaseine (DMXBA, 18) (A, C, E) and 3-(2-methoxy-4-hydroxybenzylidene)-anabaseine (2-MeO, 4-OHBA, 21) (B, D, F) as a function of pH. (A) and (B) Representative absorption spectra as a function of pH (0.5 increments from pH 5.0 to 9.0) for DMXBA and 2-MeO, 4-OHBA. Note the position of the wavelength peaks and that the long wavelength peak decreases in intensity with increasing pH for DMXBA, whereas it increases for 2-MeO, 4-OHBA. (C) and (D) DMXBA and 2-MeO, 4-OHBA, respectively, bound to Ls-AChBP in pH 8.1 and a 7.6 M NaPO4 buffer. (E) and (F) Difference spectra recorded for the complexes of the ligands with stoichiometric amounts of AChBP (30 µM of binding sites and 20 µM ligand). The spectra taken at pH values of 0.5 pH units above and below the apparent pKa value of each compound overlay closely, indicating the presence of a single ionization state.

