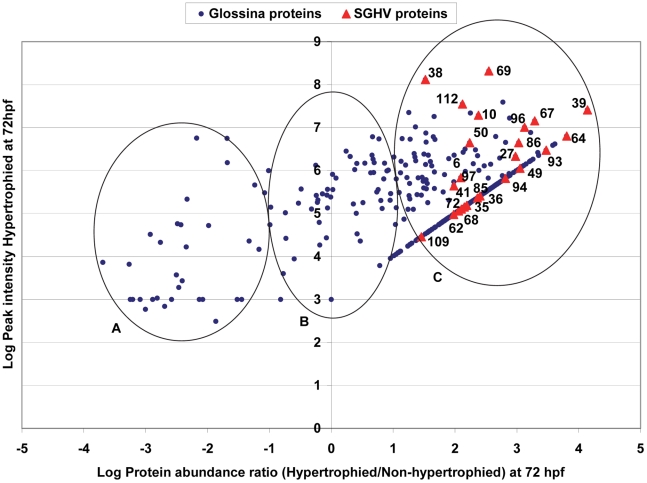
Figure 2. Plot of abundance of G. pallidipes (dots) and SGHV (triangles) proteins.
The figure shows protein abundance ratios between hypertrophied and non-hypertrophied salivary glands collected at 72 hpf. G. pallidipes and SGHV proteins are indicated in blue dots and red triangles respectively. Shown are the most abundantly expressed proteins (group A), the least abundant (group B) and the proteins detected in the hypertrophied salivary glands but were not detectable in the non-hypertrophied salivary glands (group C). To determine the ratio for group C the value for the non-detectable proteins was set to 1000. This value is just below the lowest value obtained for the least abundant protein (cn8877 Salivary gland growth factor-2).

