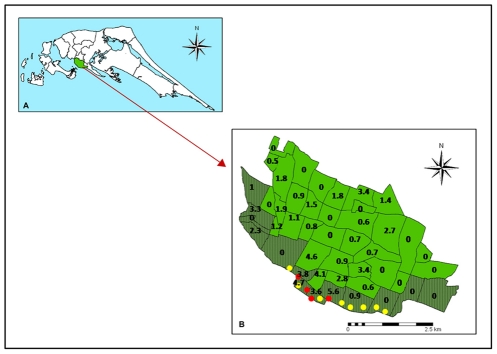
Figure 5. Relationship between dengue incidence and brackish water sites with larvae of Ae. aegypti in Jaffna.
A - Map of Jaffna peninsula; B – Map of Jaffna city showing its administrative divisions with the coastal divisions shaded in dark green. The numbers indicate the incidence of dengue per 1000 persons for the seven months October 2010 to April 2011 in each division. Red and yellow filled circles show brackish water sites along the Jaffna coastal area that were respectively positive and negative for Ae. aegypti larvae. Each circle had one or more container, well or boat that was sampled.

