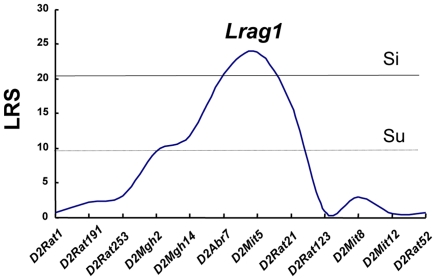
Figure 5. Details of suggestive and significant linkages in QTL analysis of the severity of aganglionosis.
The QTL on chromosomes 2 (Lrag1) showed a significant linkage to aganglionosis severity, respectively. The dotted and thin lines represent suggestive (Su) and significant (Si) thresholds, respectively. The microsatellite markers used for determining genotypes of F2 rats are presented along the X-axis. LRS, likelihood ratio statistic.

