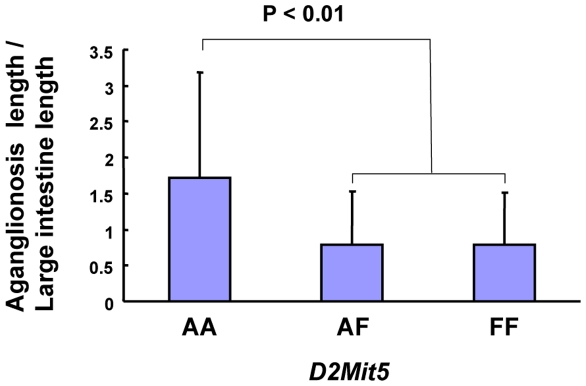
Figure 6. Effect of alleles at Ednrbsl/sl modifier loci on the severity of aganglionosis.
Genotypes from the total F2 population obtained from the marker closest to the modifier were used to assess the effects of individual loci on the severity of phenotype. The mean of aganglionosis severity (aganglionosis length/large intestine length) is plotted for each genotype class to show the relation of the number of AGH or F344 alleles and the extent of aganglionosis for this locus. Markers used to generate genotype information are listed beneath the plot. Genotype groups are defined as AGH/AGH (AA), AGH/F344 (AF) and F344/F344 (FF).

