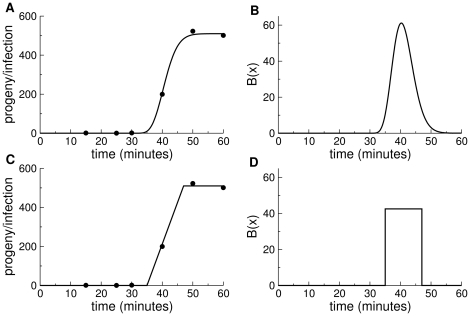
Figure 1. The burst function  and its derivation from a 1-step growth curve.
(A) A sample one-step growth curve [the six data points are from Fig. 4 in Bull et al.([20])]. The curve was fit to a gamma cumulative density function, with appropriate scaling and translation of the time axis by 28 minutes and adjusted for the time of dilution, similar to the method in Heineman et al. [21]. (B) The  function derived from the curve in (A). The area under the
  curve equals the height reached by the curve in (A), which is the burst size. (C) The one-step growth data from (A) fit by eye to a straight line. (D) The uniform (rectangular)
  function derived from the function on the left. The two examples merely show the different shapes of
  functions that can provide a suitable fit to a one-step assay, although a greater density of data in the assay may not be so permissive of functional forms. Many of the simulations presented below assume the rectangular shape, as in (D).

