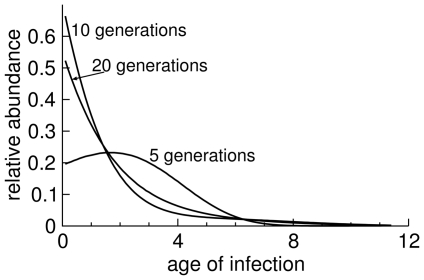
Figure 2. Deviations from stable age distribution in simulations.
Each of the three curves shows the profile of infection ‘ages’ at a specific stage of a culture, given as the approximate number of generations indicated (the number of generations associated with each curve is the number of transfers on 12 minute intervals). The 20-generations curve shows the approximate stable age distribution. Curves from earlier times indicate progressively greater deviations from stable age distribution. Infections were simulated as in Table 1. Parameters were chosen to match T7 values: the adsorption rate constant was  mL/min, cell density was
  (assumed constant),
  was uniform across 9.3 to 11.5 minutes with a total burst size of 266.

