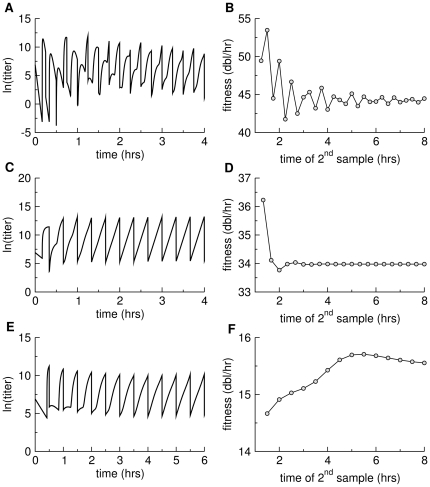
Figure 3. Deviations from stable age distribution in simulated serial transfer protocols and their effects on direct fitness estimation.
(A), (C), and (E) each show free phage density as a function of time. Transfers were performed every 15 min (top row), 20 min (middle row) or 30 min (bottom row), the vertical lines indicating the drop in titer following each transfer. When a stable age distribution has been achieved, the set of points from a single culture (between inoculation and transfer) should lie on a straight, inclined line, as is approximately true for the right-most profiles. The absence of stable age distribution is most pronounced at the left end of each figure. (B), (D), and (F) show fitness estimates ( ) for the respective panels to their left, calculated from titers separated by
  hour. The horizontal axis indicates the time of the second sample used to estimate
  . Lines connect the points for ease of visualization but have no specific meaning. The three data sets reveal different patterns of error in fitness estimation, but two sets reveal errors lasting hours after the assay is initiated. Top row is based on conditions L1 from Table 1, basic model; middle row is based on conditions L3, basic model; bottom row is based on conditions L4, basic model.

