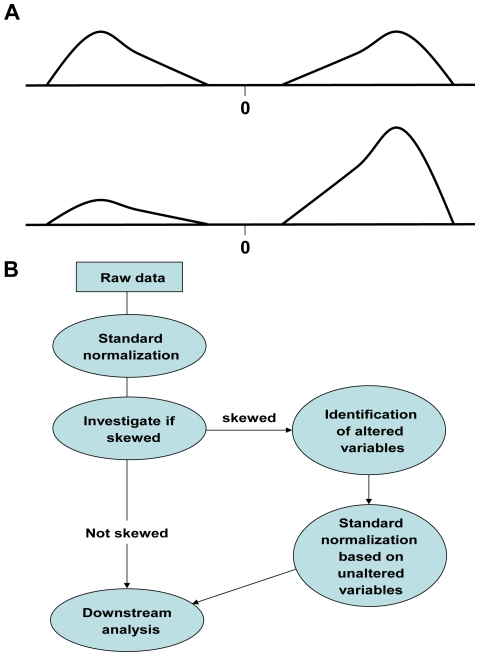
Figure 1. Skewed experiments and workflow.
(A) The distribution of the true log-ratios of the altered variables in a non-skewed (upper) and a skewed (lower) experiment. Here an experiment with samples from a treatment and a reference population is considered and the true log-ratios are the expected value of the variables' log-ratios in the absence of any type of technical variation. (B) Our suggested workflow when analyzing data from high-dimensional experiments. Here the raw data is pre-processed and some kind of standard normalization is applied (e.g. quantile or MA-normalization). The normalized data is used to determine whether the experiment is skewed or not. For skewed experiments, a hidden Markov model is used to identify altered variables and then a standard normalization based on unaltered variables is used to normalize the data.

