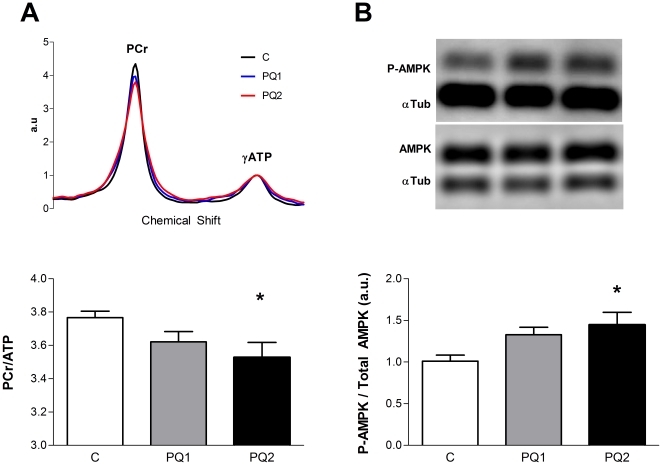
Figure 5. PQ-treatment causes energy stress in vivo and activates energy sensing pathways.
PCr/ATP ratio decreases with PQ treatment (A, with representative MR spectra above) and the ratio of phosphorylated AMPK to total AMPK increased (B, with representative western blot above). Data are expressed as means ± SEM with n = 5–9 per group. AMPK data are normalized to control average. (* p<0.05 relative to control).

