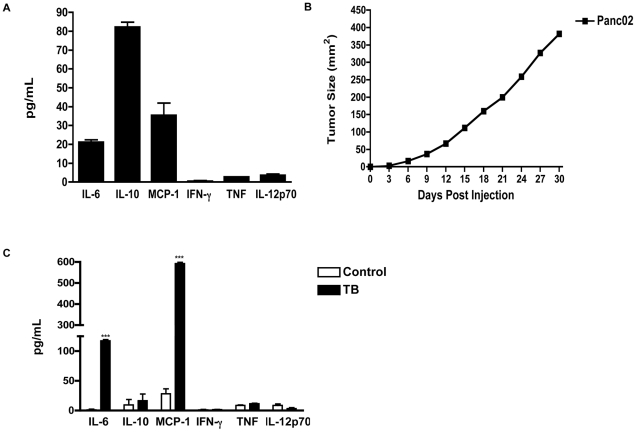
Figure 1. Increase in Pro-inflammatory factors in murine Panc02 cells and TB mice.
(A) Pro-inflammatory cytokine production by Panc02 cells as determined by CBA and flow cytometry analysis of culture supernatant. (B) Growth curve of TB mice inoculated with murine Panc02 cells. (C) Cytokine profiles of TB and control mice as measured by CBA assay. Represented is the mean ± S.E.M. of control (n = 4) compared to TB (n = 4) mice. ***p<0.001 (by two-tailed Student's t test).

