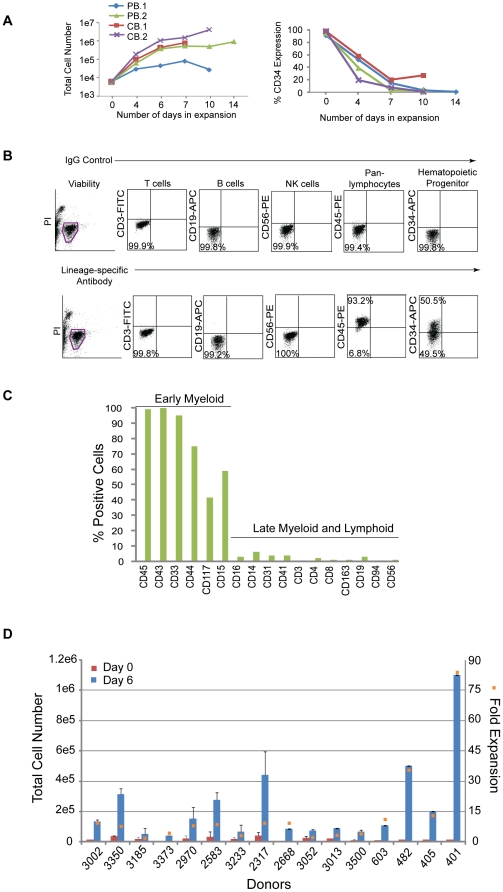
Figure 1. Hematopoietic cells enriched for CD34 expression are expandable.
A. Graphs depict the expansion of purified cells from either two peripheral (PB.1 and PB.2) or cord (CB.1 or CB.2) blood donors over time (lefthand panel) along with the percentages of the total population that are CD34+ (righthand panel). B. Representative profile of a purified population of cells after 6 days of expansion by flow cytometry on cells isolated from Donor 3002. Flow cytometry plots from control staining using IgG antibodies (upper plots) are compared to plots with antibodies specific to lineage markers (lower plots). C. The graph represents an extended analysis by flow cytometry of the characteristic profile of PB.2 cells after 10 days of expansion. The % positive indicates the fraction of the population expressing the cell surface markers on the x-axis. D. The total number of CD34+ cells across 16 different donors was assessed beginning at 0 and 6 days of expansion (left side y-axis). The fold expansion (right side y-axis, orange squares) was determined by dividing the total number of cells at day 6 divided by the number of cells at day 0 after purification. The average percent of CD34 expression across all 16 donors was 48+/−19%.

