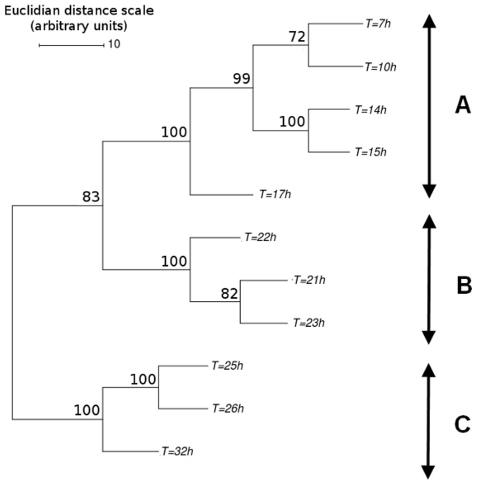
Figure 2. Hierarchical clustering of the global transcriptomic profiles obtained during the fed-batch culture.
Bootstrap values were calculated from a 100 tree replicates. Three metabolic phases can be distinguished at the transcriptomic level: (A) biomass production, (B) early lipid accumulation, and (C) late lipid accumulation. Euclidian distance scale, as calculated by MeV software, is given in arbitrary units.

