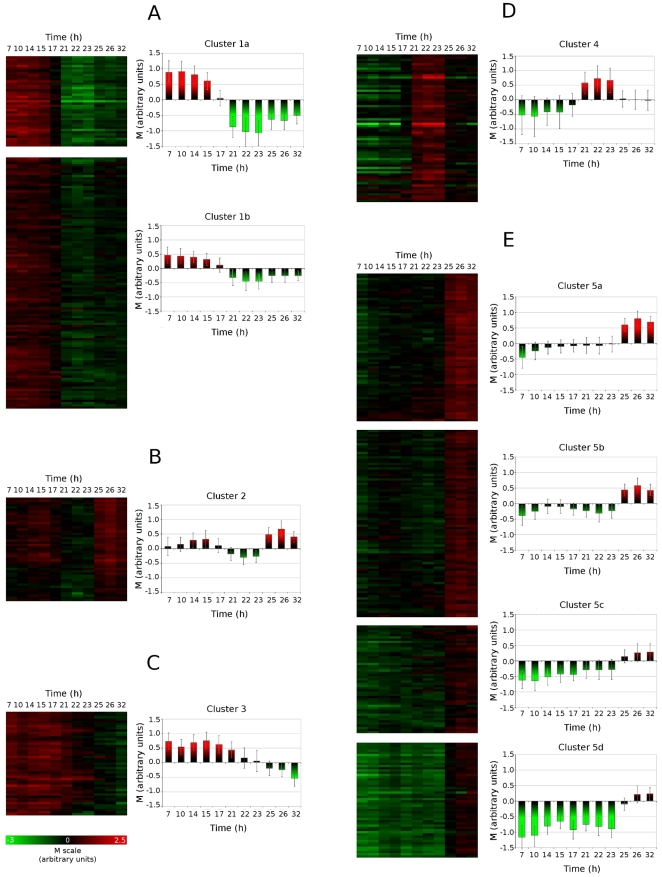
Figure 4. K-Mean clustering of the differentially expressed genes identified during the transition to lipid accumulation.
The 569 genes (detailed in Table S2) were resolved into 9 clusters, which could further be classified into 5 response profiles: (A) downregulation upon nitrogen limitation, (B) transient repression, followed by late overexpression, (C) downregulation during late accumulation phase, (D) upregulation upon nitrogen limitation, and (E) upregulation during late accumulation phase. Mean expression values and error bars were calculated, based on the expression profiles of the genes identified in each clusters.

