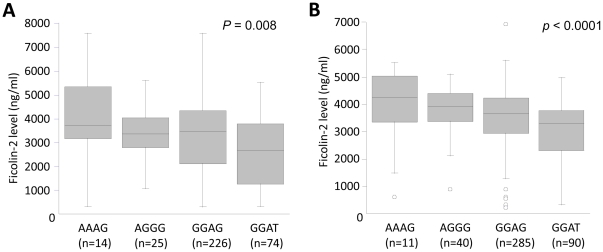
Figure 4. Association of Ficolin-2 serum levels and FCN2 haplotypes.
Box-plots illustrate medians with 25 and 75 percentiles with whiskers to 10 and 90 percentiles; Ficolin-2 serum level was segregated based on FCN2 haplotypes (-986G>A, -602G>A, -4A>G and +6424G>T). Panel (A): in patients and Panel (B): in controls. The number in parenthesis indicates number of observed haplotypes. P values were calculated by ANOVA.

