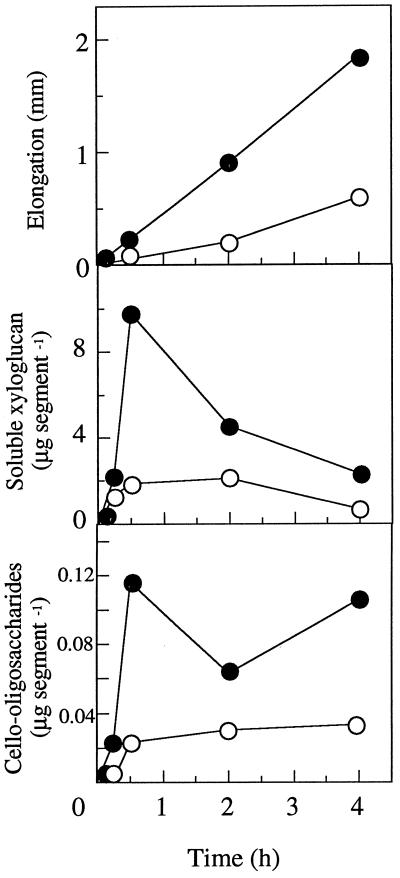
Figure 4.
Formation of cello-oligosaccharides and soluble xyloglucan in the apoplastic solution. Segments were incubated in water in the presence (•) or absence (○) of 20 μm indole-3-butyric acid. The amount of cello-oligosaccharides was determined by using cellobiose dehydrogenase (Samejima and Eriksson, 1992). Means ± se are shown (n = 3). ses fall within the respective symbols.

