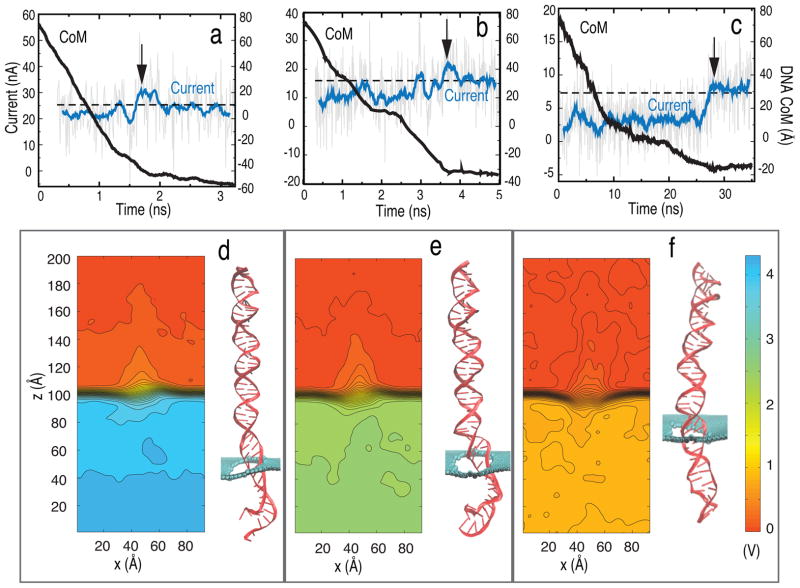
Figure 3.
Electrophoresis of dsDNA through graphene nanopores. Shown is the ionic current (blue line) and position of DNA center of mass (black solid line) for bias voltages of (a) 4.3 (SimB1), (b) 2.5 (SimB2) and (c) 0.8 V (SimB3). The arrow indicates the time instance when DNA exits the pore. The black dashed line shows the average open pore current. Also shown is the averaged potential map in the (x, z)-plane for voltage biases of (d) 4.3, (e) 2.5 and (f) 0.8 V. A snapshot of DNA is shown at the right of each potential map (pore diameter is 2.4 nm).

