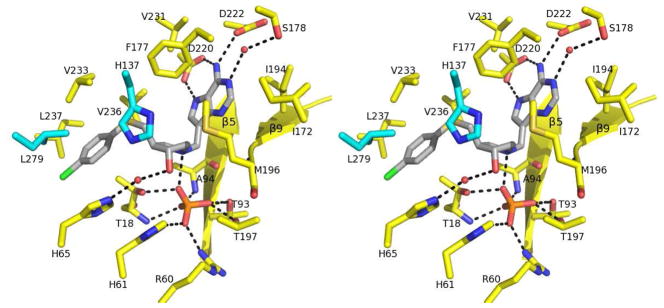
Figure 7.
Cross-eyed stereoview of active site of MTAP in complex with p-Cl-PhT-DADMe- ImmA and phosphate. The active site residues and the residues contributed from the adjacent subunit are colored in yellow and cyan, respectively. The p-Cl-PhT-DADMe- ImmA and phosphate are colored in gray and orange/red, respectively. Hydrogen bonds are indicated as dashed lines.

